New 4G Environmental Sensor on Long-Term Test: SenseCAP Combo 5-in-1 Over Three Months in Practice
 Dennis Knake
Posted On 10th August 2026
Dennis Knake
Posted On 10th August 2026
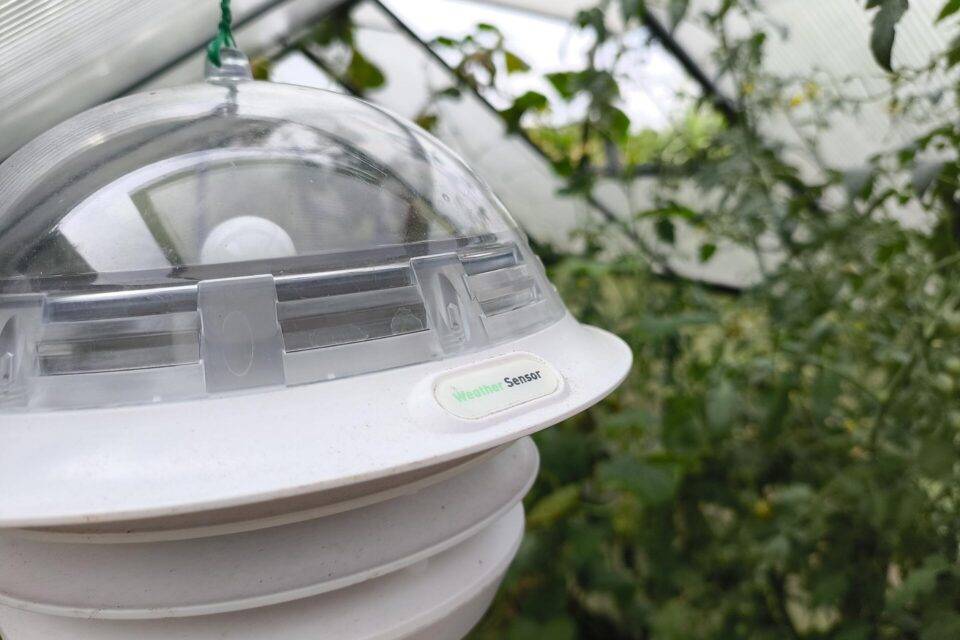
With the SenseCAP Combo 5-in-1 with 4G, Seeed Studio delivers a professional environmental sensor suited to greenhouses, among other settings. Solar-powered and cellular-connected, it is ready to run quickly. The Seeed API also leaves plenty of room to build your own dashboards. I tested the device — and above all its API for a custom dashboard — for three months ahead of the global sales launch at the end of August 2026.
- Seeed Studio sells the SenseCAP Combo 5-in-1 as a ready-to-deploy environmental sensor with 4G cellular, a solar panel and an RS485 port for up to ten additional industrial sensors; the globally distributed variant is available from the end of August, starting at 226 euros / 260 US dollars.
- The REST interface of the SenseCraft cloud makes it possible to build a convenient dashboard of your own; a central cache on your own server keeps the number of cloud requests down and goes easy on the API.
- If the cellular connection drops, the device stores up to 500,000 readings locally and uploads them once the link returns; the online status therefore says little about the actual data situation.
Who is Seeed Studio, and who does the company build for?
In the classic consumer market, Seeed Studio is largely unknown; in the maker scene, all the more so. Eric Pan founded the company in Shenzhen in 2008, and it is still headquartered there, with subsidiaries in the USA and Japan. Seeed supplies building blocks for connected applications: development boards, radio modules, gateways and sensors. Its roots lie in the open-source hardware scene, where schematics, firmware and interfaces are published openly. That still shapes the products today.
SenseCAP is the product line for ready-to-deploy environmental sensing. It includes soil sensors, weather stations, LoRaWAN gateways and a cloud of its own. The target audience follows from the feature set: an RS485 port for additional Modbus sensors, a freely selectable destination for MQTT, a lightweight protocol for machine-to-machine communication, and a documented REST interface. Seeed builds for professional users who want to pull readings into their own systems. Anyone looking for a sensor to unbox that fills a finished app is looking at the wrong device.
SenseCAP Combo 5-in-1 on long-term test
For this test I received a unit directly from China, ahead of the global sales launch. The test product is, however, the variant originally intended for the Chinese market (4G-YUN-02-Global). The now globally distributed version 4G-YUN-03-Global is technically identical, but adds a barometric pressure sensor. The global version is currently available for pre-order, and deliveries are due to begin at the end of August 2026 according to Seeed. Directly from Seeed Studio the price is around 226 euros; US customers pay around 260 dollars.
My test unit has been hanging in the greenhouse since mid-May, now a good twelve weeks, reporting every 20 minutes. It delivered air temperature, humidity, dew point, light intensity and CO₂. I did not use the additional RS485 port.
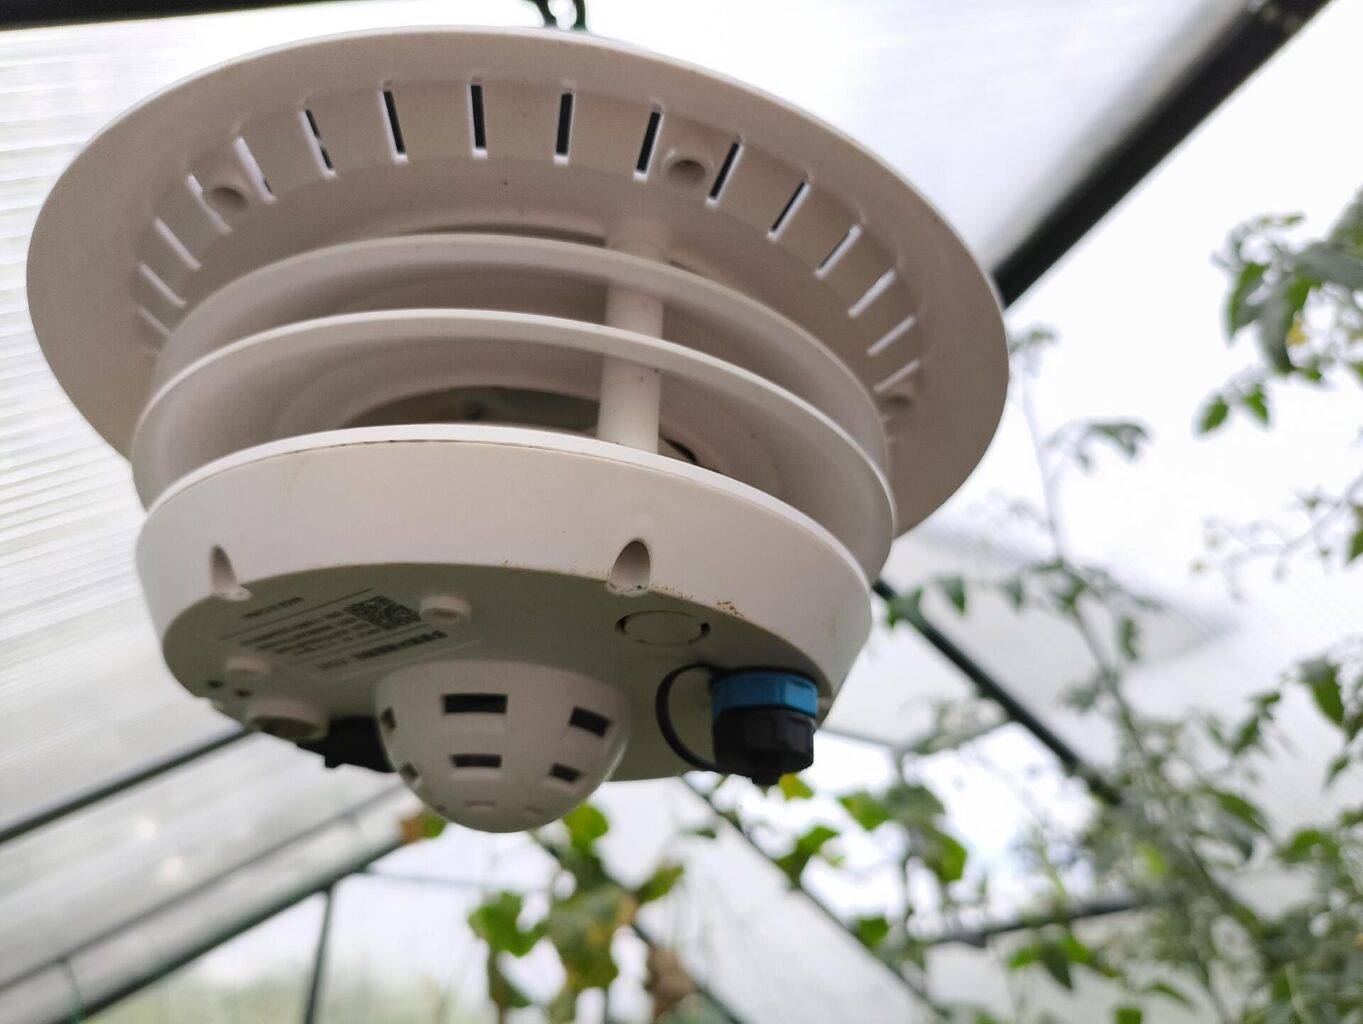
The on/off switch, the power and SIM card slots and the port for additional sensors sit on the underside of the device. Photo: Author
The housing is made from a blend of polycarbonate and ASA — the first plastic brings impact resistance, the second the colour and weather stability you know from wing mirrors and garden furniture. The protection rating is IPX5. The device is therefore protected against water jets and thus against rain, and the circuit board has an additional moisture treatment. Well equipped for the greenhouse, in other words. In dusty environments such as a grain store or a drying hall, the sensor is accordingly less suitable.
The device measures 202 by 202 by 175 millimetres and weighs 800 grams. Mounting is ideally done by suspension. Power comes from a solar panel rated at one watt peak and a lithium-ion battery with 5200 mAh. Via a USB Type-C port, the sensor draws 5 volts at 2 amps. According to the data sheet, the sensors work to ±0.2 °C for temperature, ±2 per cent for relative humidity, ±5 per cent for light intensity, and ±50 ppm plus three per cent of the reading for CO₂ up to 5000 ppm.
The measuring range for temperature runs from minus 40 to plus 85 °C. However: the User Guide gives the operating temperature as only 0 to 40 °C, and justifies the limit with the supplied power adapter, which is fit for indoor use only. More important is the dedicated section on low temperatures: below 0 °C the battery will not charge, neither from solar nor from the adapter. If it drains completely during that period, the device will not restart even on the adapter until the ambient temperature rises above 0 °C and the battery reaches a safe level. Anyone planning to run the sensor outdoors year-round has to factor that in.
How does the sensor get online?
The device uses 4G Cat.1 and takes a micro SIM in 3FF format. It covers seventeen LTE-FDD bands, among them B1, B3, B7, B8 and B20 — the ones common in Germany and Europe — plus seven TDD bands. The APN can be set freely. Which means: any SIM with a configurable APN works.
The sensor is tied to no provider. For the test I was given an IoT SIM from IXT. IXT, headquartered in Norway, is a full MVNO — a mobile provider without a radio network of its own, buying capacity from network operators while running its own core network. IXT SIM cards can therefore be used globally.
The company reaches more than 600 mobile networks in over 190 countries via multi-IMSI and eSIM. At the test location in Düsseldorf, the SIM registered on the Vodafone Germany network. Across the entire test period, the cellular connection gave no cause for complaint. No coverage problems occurred inside the greenhouse.
What does the SenseCAP portal offer?
Seeed supplies a cloud of its own with the device. You bind the sensor to your account in the SenseCraft app via the QR code on the device label. The portal then shows current readings, history charts for day, week and month, the battery level, the reporting interval and the online status. It is also where you manage API access. The portal itself is not particularly user-friendly. The UX clearly bears the handwriting of engineers and developers. For everyday use and for reading out current sensor data, it does the job. 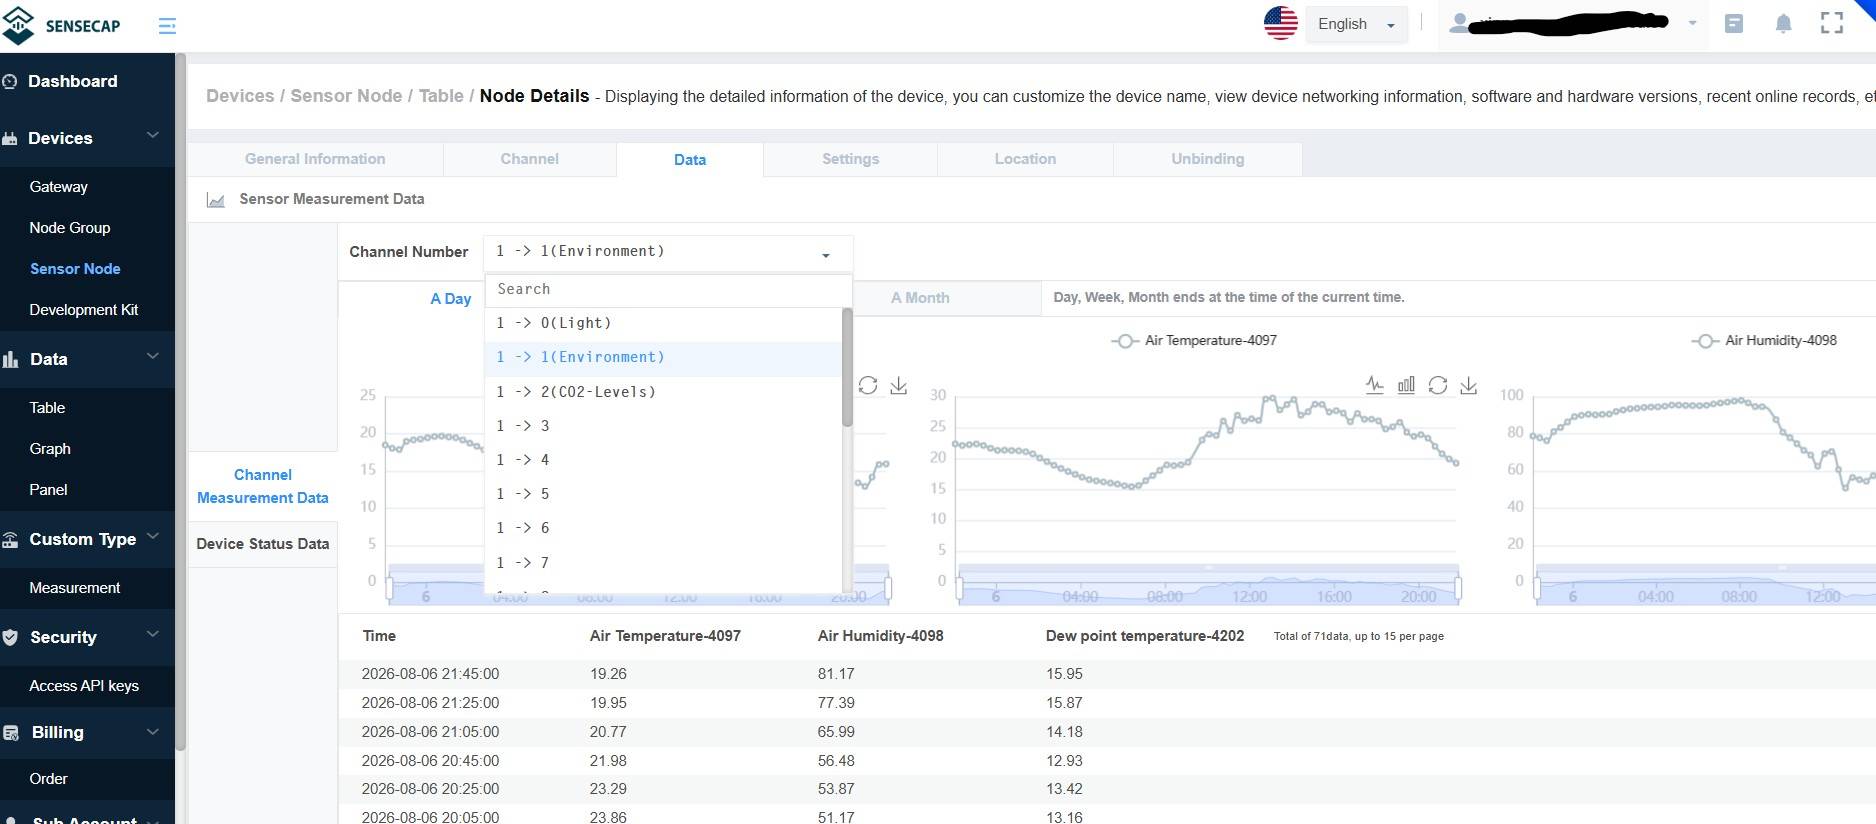
But anyone who cares about design, clarity and customisation has to get hands-on. The device also works without the cloud. If you would rather not use it at all, you can point the MQTT destination at your own server using the Sensor Hub Configuration Tool NG. I chose a different route and queried the Seeed cloud through its API for a custom dashboard.
A public dashboard of my own for the SenseCAP sensor
The dashboard runs at my home on a NAS, a network storage device, inside a Docker container. Docker packages a program together with its dependencies so that it starts independently of the machine’s operating system. Inside the container, a server program based on Node.js with the Express add-on does the work. It sits between the user interface and the SenseCraft cloud: the interface never queries the cloud, only ever my server program.
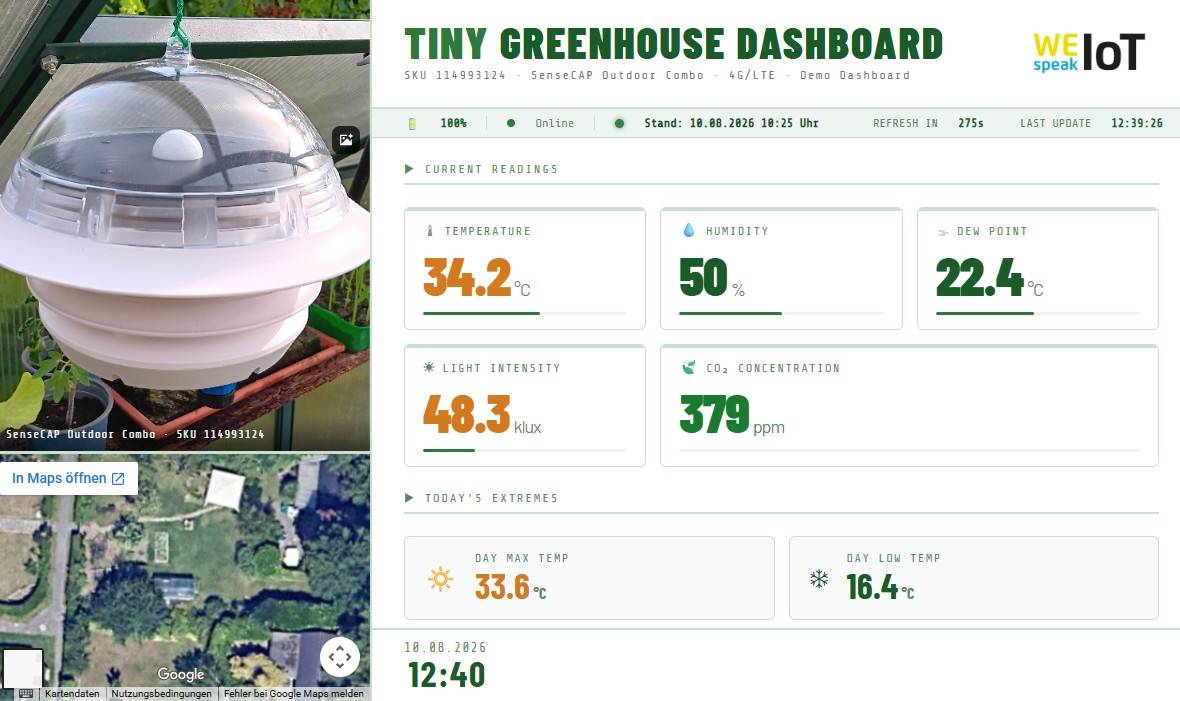
A custom dashboard gets the most out of the sensor’s feature set and its API. Screenshot: WeSpeakIoT
The API key therefore stays on the server and never appears in the browser. It has read-only rights anyway, and the device ID is fixed server-side. Queries run on fixed intervals, not on every page view. The program fetches current readings and device status every 20 minutes, a seven-day series every two hours, and a 60-day series every six. The 30-day view I derive from the 60-day data rather than fetching it a second time. That not only saves calls, it also prevents the two views from showing different values. For longer periods the program averages the raw data so that every view lands on a comparable number of points: half-hourly for seven days, hourly for 30, two-hourly for 60.
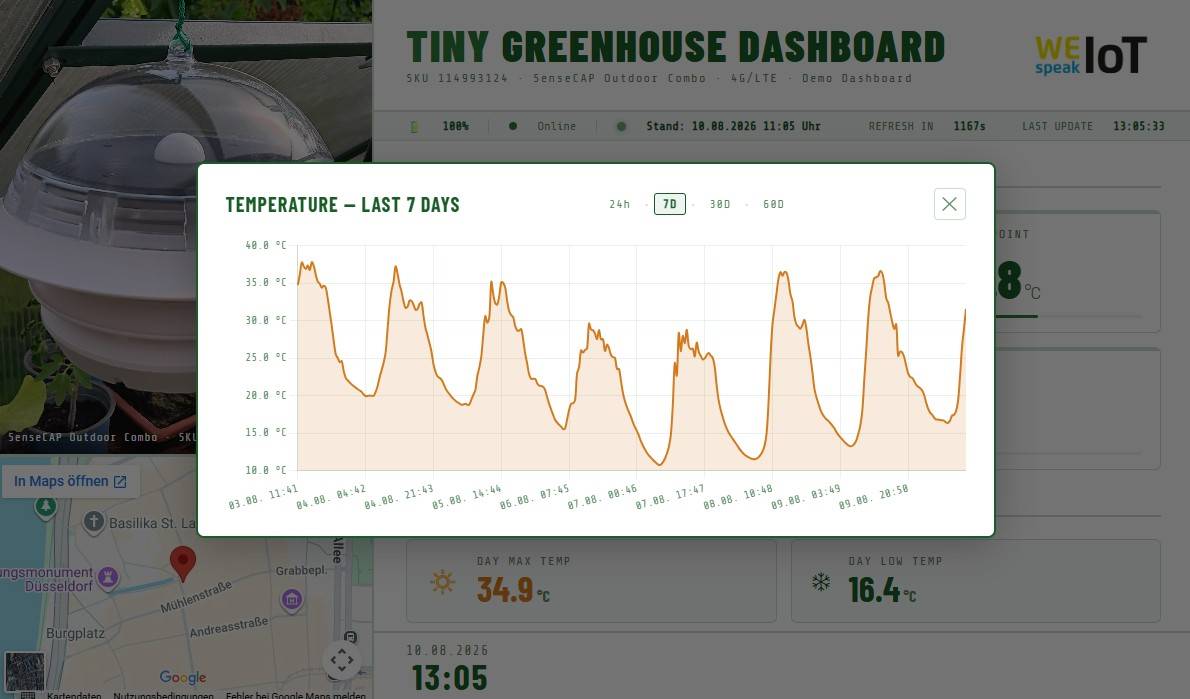
Readings over hours, days and weeks can be pulled from the API with a few tricks. Screenshot: WeSpeakIoT
Because this cache sits on the server and not in the browser, the number of requests does not change when ten people open the page at once. The interface shows five reading cards, each with a colour scale based on greenhouse thresholds. A click opens the line chart; further clicks switch between 24 hours, seven, 30 and 60 days. The dashboard is still publicly reachable for this article without my having to open up access to the NAS: instead of port forwarding and a reverse proxy, the server program pushes a complete snapshot — a copy of the original dashboard — to this site’s web server every 20 minutes: an HTML file, the readings including history data as a ready-made file, the charting script and the images.
The public dashboard shown here therefore has no backend, no credentials and no connection to the SenseCraft cloud. It serves files. The feature set stays complete, including charts and period switching; the data is at most 20 minutes old. You can see the result at wespeakiot.com/greenhousedashboard.
What does the API not document?
The interface is documented well enough to work with. Its behaviour nevertheless departs in two places from what you would expect — and that cost me more time than anything else in the whole test. The interface does not necessarily report an error when it cannot answer a request as submitted. It answers anyway. I documented two cases:
- If a query exceeds the documented 30-day window, the interface silently ignores the start time. It returns the most recent records before the end time, without any notice. I only noticed because the long-range chart had too few points. Since then I paginate backwards in rolling 30-day blocks.
- If I query a measurement my device does not carry, success code 0 comes back with an empty record. I tested this with five IDs, including barometric pressure, which my test unit does not have. All five answered empty and successful.
Anyone who only looks at the status code and not at the data itself will not notice that something is missing. On top of that comes a pitfall that has nothing to do with the device and everything to do with the documentation itself. The documentation site offers its entire contents as a PDF download. That PDF is marked as dating from 2021. And the lag is measurable. The field battery_digit, which returns the battery level to the percentage point, appears in the web version complete with an example; the PDF does not have it. Nor does it have the SIM card status query. Anyone downloading the PDF to develop offline is working with lists from 2021 — better to work with the online documentation.
The error code list is of limited help too. It carries eight codes. My test unit was bound to the Chinese station of the cloud; when I accidentally addressed the global one, code 11104 came back, with a message saying the access ID or key was wrong. Both were correct. The code appears in neither list, and the message points in the wrong direction: anyone reading it checks their credentials rather than their endpoint. A smaller stumbling block concerns the channel numbers. The interface counts differently from the portal. On my device, light sits on channel 10, temperature, humidity and dew point on channel 11, and CO₂ on channel 12. The portal shows the same channels as 0, 1 and 2. On the -03 model, barometric pressure is added on channel 13 according to Seeed’s own log analysis.
How many requests per second does the API tolerate?
How often you are allowed to query the interface, I found in no documentation. On request, Seeed support gave concrete figures in June 2026: the interface works on a token bucket with ten tokens, refilling one token per second. That allows ten simultaneous requests in a burst, and an average of one per second in sustained operation. Anyone querying several devices through the same credentials should know that figure.
Minor outages during the test period, data preserved
Twice during the test period the device went down. Both times a restart fixed it, and the sensor has run without further outages since. A confirmed cause could not be established. One explanation can, however, be ruled out: both outages were resolved by restarting the device, at the same location, with the same SIM card and on the same network. Had the mobile network caused the problem, a device restart would have changed nothing. That argues against the cellular connection as the cause and for a device-side problem.
More interesting than the outages themselves is what Seeed explained to me about the behaviour on a poor connection: if the device loses contact with the cloud, it keeps recording diligently. Up to 500,000 records fit into the local storage according to the data sheet. Once the connection returns, the sensor uploads the backlog automatically.
That is reassuring. Should the device’s link to the cloud hang at some point, no data is lost. For anyone processing that data further, a practical note follows. The online status alone is no indication of whether data exists. The measurement series can be complete while the portal reports offline. After a reconnection, values appear to show up retroactively, with timestamps from the past. Anyone running their own backend who does not know this behaviour will look for the fault on their own side first.
How did the battery hold up during the test period?
Across the entire test period from mid-May to early August, daily sunlight kept the battery consistently full. At a reporting interval of 20 minutes, the one-watt panel in the greenhouse was enough without my ever charging it. These are, however, the best light months of the year. That cannot simply be extrapolated to winter and calls for further testing. Should power run short, either an external supply or a longer reporting interval to the cloud will help.
Conclusion
The platform proves its worth in the integration. Anyone wanting to capture environmental data over cellular usually buys separately: a data logger and the sensors to go with it. Seeed’s own Sensor Hub 4G, for instance, offers the same openness — cellular, Modbus over RS485, a freely selectable server destination — and even binds up to 32 sensors, but measures nothing itself. The SenseCAP Combo 5-in-1 packs sensing, cellular, solar power, a weatherproof housing and the RS485 expansion into a single device that you hang up and switch on.
The obvious alternative is not another cellular device but LoRaWAN, a radio standard with long range and low power consumption. Seeed’s S2120, for example, measures eight parameters instead of five, but needs a base station of its own; Seeed lists the matching gateway at 99 dollars. For a single location, the cellular route saves that investment. Across several nodes on the same site the balance tips, because one gateway then serves them all. Although Seeed deliberately sells the SenseCAP 5-in-1 Combo carrier-neutral, a promotional campaign is planned shortly according to IXT. As soon as further information is available, I will publish it here.
The device captures air temperature, humidity, dew point, light intensity and CO₂. The globally distributed variant 4G-YUN-03-Global additionally measures barometric pressure. An RS485 port allows up to ten further Modbus-RTU sensors to be connected, for example for soil moisture or soil temperature.
The dew point is calculated, not measured. The data sheet explicitly lists it as a value derived by an algorithm from temperature and humidity. There is no dedicated dew point sensor inside the device. For analysis this means the dew point adds no measurement information of its own, only a conversion from two values that are already available.
Yes. The device sends its data via MQTT, and the destination can be redirected to your own server using the Sensor Hub Configuration Tool NG. If you want to keep using the Seeed cloud but build your own interface, you can access the readings through the documented REST interface.
The device takes a micro SIM in 3FF format and works on 4G Cat.1 across global frequency bands. The APN can be configured freely and there is no tie to any particular provider. Both conventional mobile contracts and specialised IoT tariffs therefore work.
The device keeps measuring and stores the values locally, up to 500,000 records according to the data sheet. Once the connection returns, it uploads the backlog automatically. The online status is therefore no reliable indication of whether readings are missing.
The interface limits requests using a token bucket with ten tokens and a refill rate of one token per second. That allows ten simultaneous requests in a burst and an average of one per second in sustained operation. These figures appear in no public documentation and come from an enquiry to Seeed support.
Disclosure: Seeed Studio provided the sensor free of charge, IXT the SIM card. Neither company made any stipulations regarding coverage, and no affiliate arrangement exists.

You may also like